What lands in the recipient site
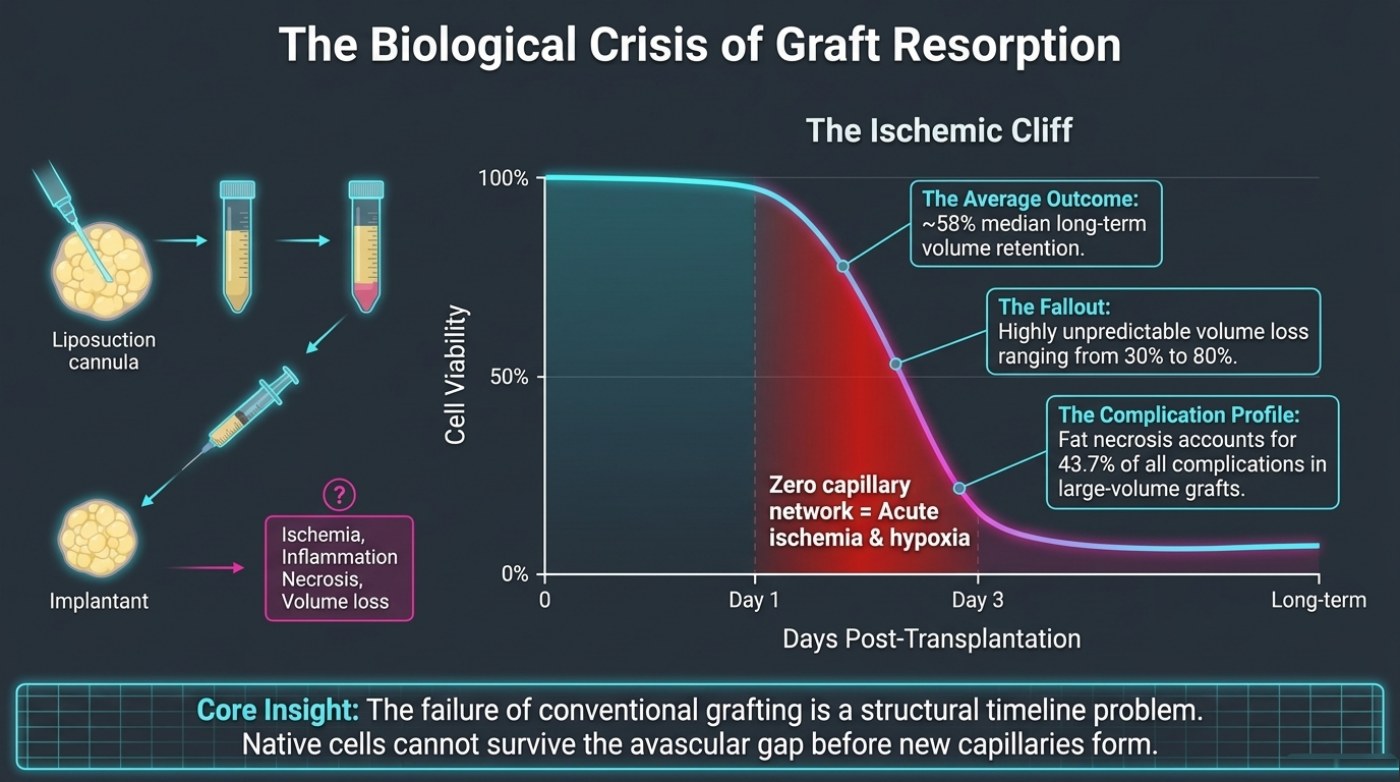
The resorption slide in deck drop2_3 is titled “The Biological Crisis of Graft Resorption”, and the curve at its centre is labelled “The Ischemic Cliff”. The curve plots cell viability on the vertical axis against days post-transplantation on the horizontal. It begins flat at 100%, holds there briefly, then falls in a bend steep enough to have earned the name. The slide’s annotation for the mechanism is four words long: zero capillary network equals acute ischemia and hypoxia.
The short version
- A freshly placed fat graft has no capillary network, so survival depends on diffusion until new vessels arrive.
- The ischemic cliff plots viability falling from near 100% at implantation to a low plateau after the steepest drop around day three.
- The slide reports a median long-term volume retention of about 58% after a conventional transfer.
- Volume loss is reported as a range of 30% to 80%, described on the slide as highly unpredictable.
- Fat necrosis accounts for 43.7% of all complications in large-volume grafts, making it the largest single contributor.
That is the entire problem in one line. A freshly placed fat graft is not connected to the host circulation. Until new capillaries grow into it, the tissue depends on diffusion from the surrounding bed and on whatever it can sustain without a blood supply. The first days therefore matter more than the first months: that is when the volume which will never come back is decided, and it is why the deck describes the failure as structural rather than accidental.
The graphic on the left of the slide traces the same sequence in steps — liposuction cannula, harvested tissue, transfer, implant — and then pairs a question mark with a box reading ischemia, inflammation, necrosis, volume loss. The question mark is the point. The outcome of a conventional transfer is not one fixed number, and the slide says so before it says anything else.
Reading the curve from left to right
| Position on the curve | What the curve shows | How the slide labels it |
|---|---|---|
| Day 0 | Viability still at or near 100% | Implantation, with no capillary network |
| Day 1 | The decline begins | Ischemia and hypoxia set in |
| Day 3 | The steepest part of the fall | The deepest section of the cliff |
| Long-term | Viability flattens at a low plateau | What survives remains; the rest is reabsorbed |
The dashed marker the slide places inside the red zone is not at hour zero and not at the end. It sits between day one and day three, where the zero-capillary-network annotation explains why the curve bends there. The shape matters more than any single point on it: a slow beginning, a short and steep middle, and a plateau that is far below where the curve started.
The three figures attached to the curve
Three callout boxes hang off the curve and carry the deck’s own numbers. Between them they answer three separate questions: what the typical outcome looks like, how wide the variation is, and which complication does the damage.
| Callout | Figure | What it describes |
|---|---|---|
| The Average Outcome | ~58% median long-term volume retention | Retention at long-term follow-up after a conventional transfer |
| The Fallout | 30% to 80% | The range of volume loss, described on the slide as highly unpredictable |
| The Complication Profile | 43.7% | Fat necrosis as a share of all complications in large-volume grafts |
The word median carries weight in the first figure. A median describes the middle of a distribution, so ~58% long-term retention means half of the results in the material sit above it and half below — not that a given graft will keep 58%. Our published guide to fat survival makes the same point for readers planning a procedure: retention belongs in a range with variability between patients and between recipient sites, and a single percentage does not transfer to an individual case.
The second figure is the width of the spread. 30% to 80% is not a narrow band; it is the difference between a result that looks close to the plan and a result that looks like a different procedure. Note that the range is stated as loss, so a graft at the low end of the band is the successful version, and the deck’s own adjective for it is unpredictable.
The third figure explains where the loss comes from. Fat necrosis accounting for 43.7% of all complications in large-volume grafts makes necrotic tissue the single largest contributor to complications in that group. It also ties the curve to the complication profile, because the same hypoxia that pulls viability down the cliff is the process that leaves dead tissue behind. The deck’s complication slide is not a separate topic from its viability slide; they are two views of one event.
| Stage, in the order the slide gives it | What the graft experiences | What the reader later sees |
|---|---|---|
| Ischemia | The graft is placed with no capillary network of its own | Nothing yet — this stage is invisible at the time |
| Inflammation | The tissue cannot clear the debris of the hypoxic phase | Early swelling and firmness |
| Necrosis | Cells that did not survive the window break down | Areas that feel irregular or lumpy |
| Volume loss | Necrotic tissue is reabsorbed by the body | The measured difference, months later |
Why the deck calls it a structural problem
The closing box on the slide states the thesis plainly: the failure of conventional grafting is a structural timeline problem. Structural, because the absence of vessels is not a handling error — it is a description of what transplanted tissue is at the moment it lands. Timeline, because the damage accumulates inside a window measured in days. Both halves matter, and the second half is the one that opens a door.
If the interval before perfusion returns is the limiting variable, then the interesting question stops being which instrument is best and becomes whether the tissue can be supported across that interval. That is what the briefing’s next section answers, and it is why the answer is biological rather than mechanical: cells added to the graft and described not as replacement fat but as support while vessels arrive.
What the cliff does not say
A survival curve is not a prediction about one person. The slide does not say that every graft loses volume at the same rate, because it reports a range of 30% to 80%. It does not identify which grafts sit at the good end of the band, and it does not turn a median into a plan. For a consultation, the useful translation is a range, a staging plan and documented follow-up rather than a figure.
Frequently asked questions
Why does the steep part of the decline happen between day one and day three?
Because until new capillaries reach the tissue, the graft is surviving without a blood supply. The slide places its zero-capillary-network annotation inside that window and labels the consequence acute ischemia and hypoxia. Once perfusion is restored the curve flattens rather than continuing to fall.
Is 30% to 80% the chance of losing volume?
No. It is the reported range of volume loss across conventional transfers in published material, not a probability. The deck presents it alongside a median retention figure so that both the typical outcome and the width of the spread around it are visible.
Does the slide recommend anything?
No. It explains why conventional grafting behaves the way it does. Whether any technique suits an individual is a question for a board-certified surgeon after an examination, and nothing on the page changes that.
This is published information, not medical advice — a board-certified surgeon must assess whether a procedure suits you.
Related reading
The cliff described here sits behind several other questions on this site.
- Why Transplanted Fat Survives — or Does Not — the patient-facing guide to the avascular phase and the harvesting variables that condition survival
- How Much Fat Can Be Removed in One Liposuction Session? — why the published positions on volume limits differ, and what that means for large-volume grafting
- Liposuction Recovery Week by Week — the compression, massage and exercise milestones that follow a large-volume procedure
Two tools on this site are worth running before a consultation: the risk and volume limits tool and the pre-operative checklist.